
In this project we will monitor populations of predators and voles to understand how they behave in case of treatments of anticoagulant rodenticides. These chemicals are used to reduce vole damages on grasslands for livestock and crops.
Within our system, we can consider two scenarios:
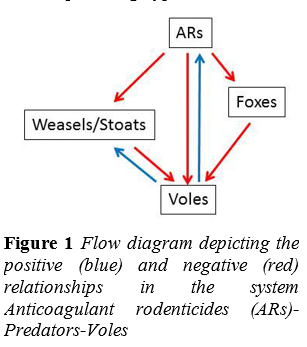
In the first scenario, where there is no use of anticoagulant rodenticides, (i) changes in the density of voles produce numerical responses of specialist predators (bottom-up effect). In addition, specialist predators (here stoats and weasels ) limit populations of voles with their numerical response, and generalist predators (here foxes) with their functional and numerical response (top-down effect).
However, in the scenario with anticoagulant rodenticides:
(ii) Both voles and predators are limited by anticoagulant rodenticides in terms of abundance. Predators show a decline in density and consumption of voles. Predators will not have an impact on the abundance of voles because voles would have died poisoned by rodenticides in any case (Figure 1).
Therefore, one of the variables that alter the predator-prey relationships is the use of anticoagulant rodenticides (see for example Jacquot et al. 2013).
In the Haut Doubs (Franche-Comté, France) the anticoagulant rodenticide provided to farmers for this kind of control is bromadiolone. For our project, we will survey 10 study sites (5 with treatment and 5 untreated). In the previous selection of localities, we had availability of data of bromadiolone use during the last 7 years, due to the collaboration between FREDON Franche-Comté and Laboratoire Chrono-Environnement.
The amount of bromadiolone use can vary greatly in quantity and in the month and site. For example, in site 1, bromadiolone is generally applied throughout the whole year in big quantities (Figure 2). Interestingly, the abundance of voles can be relatively high in some periods, even with such big quantities and regularity of bromadiolone use.
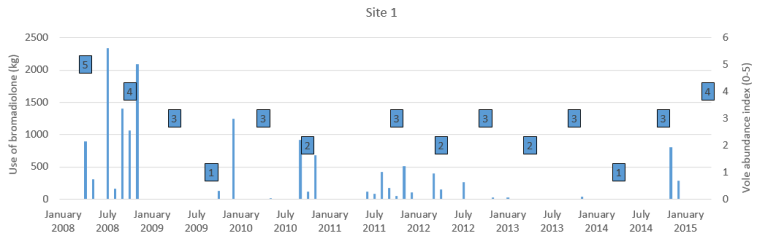
Figure 2. Quantity of bromadiolone applied in Site 1 depending on the month and year. The blue boxes represent the abundance of voles (scale from 0, no voles, to 5, maximum levels of abundance meaning vole outbreaks).
On the contrary, I show an example of another site, where the use of bromadiolone is much smaller and focused during the autumn of some years (Figure 3). Vole population trends seem less changeable, but the abundance of voles may still achieve low levels when there is no bromadiolone use.
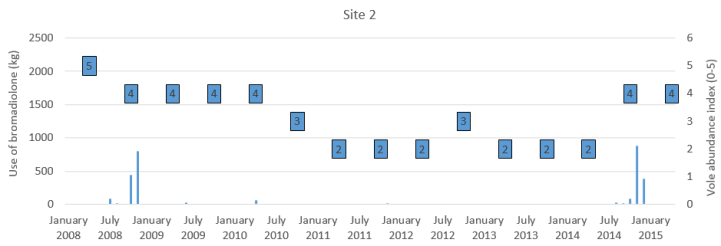
Figure 3. Quantity of bromadiolone applied in Site 2 depending on month and year. The blue boxes represent the abundance of voles (scale from 0 to 5).
This opens nice questions, interesting to study:
Farmers in some cases apply bromadiolone locally at the vole galleries while in other cases they apply bromadiolone intensively and at larger scale. Is this explaining variation of bromadiolone use between sites? Thus, is the level of intensiveness of the farming industries and their land uses explaining bromadiolone use? or is it mainly related to traditional habits of farmers in each area?
Fortunately we could get answers to these and other questions by direct contact to farmers, while surveying the predator and vole populations.
